May 6, 2021
Technical library
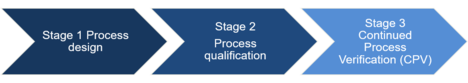
Indeed, the first step consists in defining a process suitable for routine commercial manufacturing based on knowledge gained through development and scale-up activities. Afterwards, the goal of the second step, the process qualification, is to evaluate and determine if the commercial manufacture is reproducible. In order to do so, process performance qualification (PPQ) is required for the finalisation of qualifications for facilities, equipments and utilities. And finally, the CPV is a continual assurance that the process remains in a state of control (the validated state) during commercial manufacture.
A successful validation program depends on the collection of the information about each product during the first stage. Consequently, the manufacturer should:
- Understand the sources of process variation,
- Detect the presence and degree of variation,
- Understand the impact of variation on the process and ultimately on product attributes,
- Control the variation in a manner commensurate with the risk it represents to the process and product.
All the stages are interconnected and collected data from this process are gathered in Risk Assessment (RA – 1) Product Control Strategy (PCS – 2) and Data Trending Plan (DTP – 3).
1) Risk Assessment:
The purpose of this document is to map all the product risks (see article on Risk assessment)during all the process (from manufacturing to storage) and their likely effects on product performance. The key point is to perform this mapping with the different departments involved during the process. The proper evaluation of risks has to be completed and verified at least by the following departments: the research & development, production and quality.

Some basic tools can be used to structure the risk management by organizing your data and facilitating decision making like:
- Flowcharts
- Check sheets
- Batch Records
- Process Mapping
- Ishikawa diagram or fish bone diagram.
In practice, the workgroup evaluates all the parameters of the process and quotes them regarding Critical Quality Attributes (CQAs). A CQA is a physical, chemical, biological, or microbiological property or characteristic that should be within an appropriate limit, range, or distribution to ensure the desired product quality (in other words check if the product meets the specifications written in the authorities' registration file e.g. monographies). If there is a chance that error occurred and could lead to a mistake and a potential hazard on one CQA, then this parameter must be identified as a Critical Process Parameter (CPP). But the reality is more complicated than that, it is not difficult to understand that if there is a sudden big change of one CPP it will have an impact on CQA for sure. The difficulty here is to define or determine the amount of changes of one CPP on CQA.
Beside this quote, the occurrence (number of events) and detection needs to be filled. These information require data from the regulatory affairs/quality (to define the CQA), the production (to identify frequent errors that occurred on the shopfloor) and the research and development (to define the potential impact on the product).
Also, this document indicates the target and range associated for each parameter; it can be of 2 types:
- NOR - Normal Operating Range: range used in production and written in the batch record (narrow range).
- PAR - Proven Acceptance Range: range used in the scope of deviation (wider range). For instance, if the production does not respect the NOR, the deviation can be closed thanks to the data coming from the PAR.
All this data is based on industrialization files, Design of Experimentation (DoE), Process Experimentation (PE) and of course validation files. According to FDA guidance, all the parameters that may have an impact on CQA must be controlled and checked carefully. In other words, the pharmaceutical companies must prove that all CPP are under control by showing test results (with an equipment qualified regarding guidance 21 CFR part 11…) or double checked by operators.
The test strategy is explained in the next document, the PCS: Product Control Strategy.
2) Product Control Strategy (PCS)
A control strategy is designed to ensure that a product of required quality will be produced consistently. The Product Control Strategy (PCS) consists in listing all the tests available during the process, it is based on product and process understanding and risk management.

For each CQA, there is a list of tests available. For the authorities, the pharmaceutical companies must prove that the process remains under control by using a series of tests. The elements of the control which contribute to the final product quality may include, but not limited to:
- Controls on material attributes (e.g. raw materials, starting materials, intermediates solutions…)
- Controls implicit in the design of the manufacturing process (e.g. sequence of purification steps (biotechnological/biological drug substances) or order of reagents additions (chemical entities)
- In-process controls (including in-process test and process parameters)
- Controls on drug substance (e.g. release testing).
There are 2 methods for developing strategy: the traditional and the enhanced approaches. The traditional approach consists in determining set of point and narrow range used in production in order to ensure consistency. This approach limits the flexibility in operating range to address variability. Whereas the enhanced approach has a better process and product understanding that the traditional one, so the sources of variability can be identified in a more systematic way. Of course, the control strategy can be developed through the combination of approaches. The PCS ensures that all range determined for each CQA is correct and consistent and that doesn’t mean that the substance specification should ensure that each CQA is within the appropriate range, limit, or distribution. The drug substance specification is one part of the control strategy and not all CQAs must have a specification. For example, the confluence of cell layer cannot be determined by a specification. So, a CQA can be:
- Controlled based on specification through final release testing (e.g.: potency)
- Controlled and confirmed based on specification through Real Time Release Testing (RTRT) (e.g.: pH, monitoring heat chamber temperature…) at single or multiple locations in the process
- Controlled based on in-process control (e.g.: confluence of cell layer)
Then, these data are analysed and trended in the document Data Trending Plan (DTP).
3) Data Trending Plan (DTP)
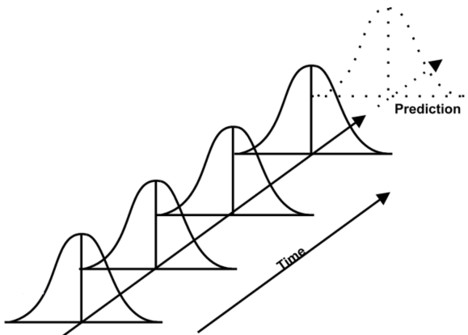
The purpose of the data trending plan is to collect data related to CQAs, CPPs and analysis that reveal any statistical signals that become evident over time (see Figure 1). This analysis aims at maintaining control over all the process within specification and hence does not lead to a formal investigation. It’s designed to detect any variations and it can also identify opportunities to improve process control before launching process deviation.
A capable process indicates that it is running consistently within specifications. So, the process capability analysis compares the process variation to specifications. It is often represented by Ppk (performance) & Cpk (capability) index. The Cpk only accounts for the variation within the subgroups (e.g. batches of the day), it does not account for the shift or drift between group. Whereas the Ppk includes the variation of all measurements. It holds both the variation within subgroups and the shift and drift between them. In other words, the Cpk is a good short-term index and Cpk a long term one.
To summarize, here are the 3 steps in establishing CPV meeting:
-
Define parameters and signal criteria:
Thanks to a statistical approach, data from tests, batches records etc., are evaluated during CPV meeting to define which parameters to follow, signal criteria, set limits and adjust array/range if needed.
The process variables can be special or common causes. The scope of a CPV program is to maintain common causes variable stable and predictable; special causes are inherent of each process and cannot be eliminated (e.g. flooding…).
Some signals cannot be characterized during the industrialization or validation step. These signals assess predicted performance. There are 2 types of limit control for signals:
- Alert threshold: alert unexpected data. Therefore, the quality is not affected. It is generally 3+/- process standard deviation.
- Action threshold: indicate that something wrong happened, and that the product quality is compromised.
The complexity in pharmaceutical industry is that the process uses live cells and variations are hard to capture and characterize. In any case, if the signal (data coming from CQAs, CPPs…) remains within the specifications, no action needs to be taken. Whereas the signal is located out of specification, actions and investigations must be launched (according to quality management system).
-
Establish monitoring and evaluation frequency
This comes after defining the signal and data to focus on. This step consists in reacting accordingly in real time by monitoring signals. In an ideal manufacturing world, CPV monitoring identifies signal in real time and allows the process to be adjusted. The difficulty here is to define if the signal is a drift or a shift. The frequency plan should take into account:
- The risk of this parameter to be deviated from its acceptable range.
- Manufacturing frequency.
- Level of historical process knowledge.
-
Establish signal evaluation criteria and actions
The purpose of the CPV program is to identify variation regarding the specification/acceptance range. But there can be variations within the acceptance range so, it is important to adapt the response of the signal:
- No action required: the response is within the variation of the signal, there is not enough significant data to go further (root cause analyse, CAPA…).
- Evaluation: the response is not corresponding with the signal expected from collected data. It requires a technical evaluation to understand the cause. According to the cause determined, a CAPA could be necessary.
- Escalation: the response is not corresponding with the signal expected from collected data. It required a product impact (from technical expert e.g. SMEs…) and a root cause analysis. The signal is followed up by QMS (e.g. with CAPA).
There are different tables/charts on different technical libraries that explained how to respond based on data, the Chart 1 shows an example of risk-based strategy that could be used to develop a CPV plan. It is important to note that all the information must be analysed and account for batch-to-batch variability, teams, plants …

Conclusion
Pharmaceutical companies’ challenge is to execute the manufacturing according to the process validation lifecycle and so, to respect the quality asked by the authorities. If the CPV is correctly handled and established that means the product quality meets the desired criteria (by enhancing the product/process knowledge). This program helps pharmaceutical companies to prepare the expectations of regulatory inspection. Indeed, regulatory agencies such as FDA, WHO, EMA… provide guidance to promote this program. The latest 2020 warning letter trends continue to indicate that there is an evident gap in understanding and adoption of the basic ideas.
This would, in the long run, change how the manufacturing process is managed: Manufacturing is moving from a reactive to a proactive model.
References:
https://www.fda.gov/files/drugs/published/Process-Validation--General-Principles-and-Practices.pdf
https://www.researchgate.net/publication/321977835_Continued_Process_Verification_Statistical_Tools_for_Process_Control_and_Improvement_A_Systems_Approach/link/5a3bf358a6fdcc21d877ef01/download
https://www.biopharminternational.com/
https://www.fda.gov/media/71535/download
https://www.fda.gov/files/about%20fda/published/Control-Strategy-and-ICH-Q11--John-Smith--Ph.D.--October-18--2012--AAPS-Annual-Meeting.pdf
https://www.researchgate.net/publication/321977835_Continued_Process_Verification_Statistical_Tools_for_Process_Control_and_Improvement_A_Systems_Approach/link/5a3bf358a6fdcc21d877ef01/download
https://www.pharmaceuticalonline.com/doc/put-your-continued-process-verification-cpv-data-to-work-0001
-
Technical library
Jan 21, 2021
N'tech event: Risk analysis, the key point of the qualification process
First webinar around a Life Sciences topic
-
Technical library
Oct 8, 2019
Risk Analysis Approach for Computerized Systems
The goal: reduce risks in accordance with applicable regulations
-
Technical library
May 6, 2019
All you need to know about the Ishikawa diagram
Everything you have ever wondered about the Ishikawa diagram will be revealed